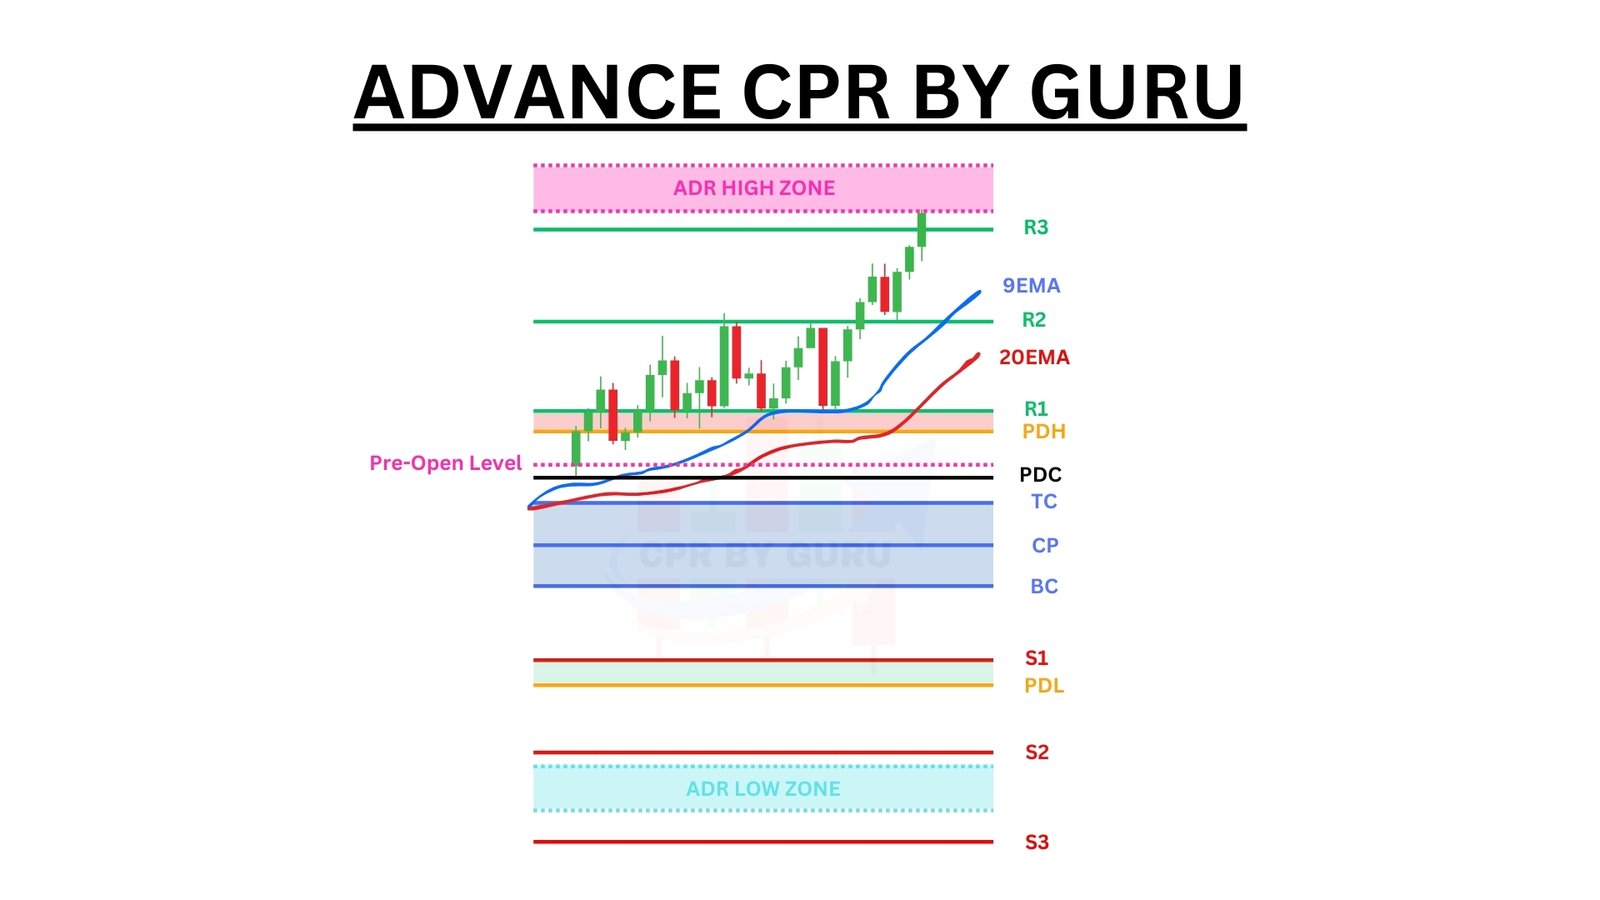
Understanding Trading View Indicators
Trading View is a renowned platform in the trading community, celebrated for its comprehensive charting tools and expansive social trading network. It serves as an essential resource for both novice and seasoned traders, providing a repository of real-time data, user-friendly charts, and a vast array of technical indicators. These indicators play a pivotal role in technical analysis, the practice of predicting future price movements based on historical market data.
Trading View indicators are integral for traders as they offer crucial insights into market conditions and potential trading opportunities. These indicators can be categorized broadly into four types: trend-following, momentum, volatility, and volume indicators. Trend-following indicators, like Moving Averages and MACD (Moving Average Convergence Divergence), help identify the direction of market trends. Momentum indicators, such as the RSI (Relative Strength Index) and Stochastic Oscillator, measure the speed and magnitude of price movements, indicating overbought or oversold conditions.
Volatility indicators, including the Bollinger Bands and ATR (Average True Range), assess the degree of price variation over a certain period, alerting traders to potential breakouts or consolidations. Volume indicators, like the OBV (On-Balance Volume) and Volume Oscillator, analyze trade volume to confirm the strength of price movements and identify potential reversals. By offering a quantitative assessment of market trends, these indicators assist traders in making informed decisions and improving trade accuracy.
The utilization of multiple indicators in tandem often yields a more robust analysis. For instance, combining a trend-following indicator with a momentum indicator can provide comprehensive insights into both market direction and the strength of price movements. Moreover, Trading View allows customization of these indicators to align with specific trading strategies. Tailoring settings to fit individual preferences can enhance the predictive accuracy and overall effectiveness of the indicators.
Understanding how to leverage Trading View indicators effectively is crucial for any trader looking to make well-informed decisions. By combining various types of indicators and customizing them according to individual trading styles, traders can refine their strategies and potentially improve their trading outcomes.
Top Trading View Indicators and How to Use Them
Understanding and effectively using top Trading View indicators can significantly boost your trading strategies. We will explore some of the most widely-used indicators such as Moving Averages (SMA and EMA), Relative Strength Index (RSI), Bollinger Bands, MACD (Moving Average Convergence Divergence), and Fibonacci Retracement. Gain practical insights into setting them up and interpreting their signals.
Moving Averages (SMA and EMA)
Simple Moving Averages (SMA) and Exponential Moving Averages (EMA) are essential indicators for identifying trends. While SMA calculates the average price over a specific period, EMA gives more weight to the most recent prices. To set up on Trading View, go to the ‘Indicators’ tab, search for SMA or EMA, and select the desired period (e.g., 20-day or 50-day). EMA reacts faster to price changes, making it valuable for short-term trading, while SMA is more stable, aiding long-term analysis. In a trending market, prices moving above or below these averages can signal strong movements. However, in ranging markets, they may generate false signals.
Relative Strength Index (RSI)
RSI measures the speed and change of price movements, providing a momentum oscillator that ranges from 0 to 100. An RSI above 70 typically signifies an overbought condition, while below 30 indicates oversold. In Trading View, access the ‘Indicators’ tab, search for RSI, and set the default 14-day period. This indicator is particularly useful for spotting potential reversals. However, RSI can give misleading signals in a strong trend, so combining with other indicators is advised.
Bollinger Bands
Bollinger Bands consist of a middle SMA and two outer bands representing standard deviations. Set up by selecting Bollinger Bands from the ‘Indicators’ menu. These bands contract in low volatility and expand in high volatility, helping traders identify possible breakout and reversal spots. When prices touch the upper band, it may indicate overbought conditions, and touching the lower band may reveal oversold conditions. This indicator works well in ranging markets but can be less effective during strong trends.
MACD (Moving Average Convergence Divergence)
MACD helps in identifying changes in the strength, direction, momentum, and duration of a trend. Comprised of the MACD line, signal line, and histogram, it can be added through the ‘Indicators’ tab on Trading View. A bullish signal occurs when the MACD line crosses above the signal line, while a bearish signal arises when it crosses below. It’s a powerful tool in trending markets but may generate false signals in ranging conditions.
Fibonacci Retracement
Fibonacci Retracement levels are used to determine potential support and resistance levels. In Trading View, choose the ‘Fib Retracement’ tool and select the swing high and swing low points. This will automatically plot the key levels like 38.2%, 50%, and 61.8%. These levels are vital in forecasting potential reversal points and are highly effective in trending markets. However, it’s important to combine this tool with other indicators for better accuracy.
By mastering these indicators and understanding their applications, you can enhance your trading strategies and make more informed decisions in various market conditions. Each indicator offers unique insights, so it’s beneficial to use them in combination for a comprehensive market analysis.
